


Gifting Made Simple
Give the Gift of ChoiceClick below to purchase a Prairie Mall eGift Card that can be used at participating retailers at Prairie Mall.Buy Gift CardHome
The Wall Street Journal Guide to Information Graphics: Do's And Don'ts Of Presenting Data Facts Figures
Coles
Loading Inventory...
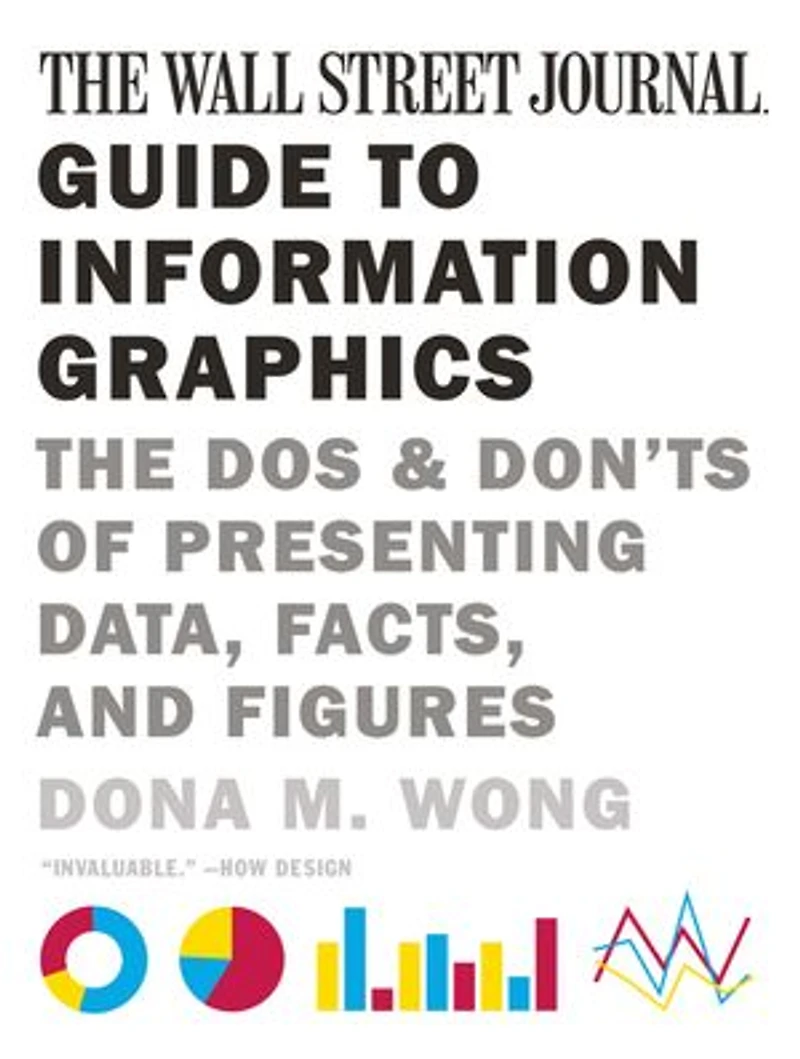
The Wall Street Journal Guide to Information Graphics: Do's And Don'ts Of Presenting Data Facts Figures in Grande Prairie, AB
Current price: $25.79
Original price: $32.25
Coles
The Wall Street Journal Guide to Information Graphics: Do's And Don'ts Of Presenting Data Facts Figures in Grande Prairie, AB
Current price: $25.79
Original price: $32.25
Loading Inventory...
Size: Kobo eBook
*Product information and pricing may vary - to confirm current pricing, availability, shipping, and return information please contact Coles. In the event of a pricing discrepancy, the retailer's price will apply.
The definitive guide to the graphic presentation of information.
In today’s data-driven world, professionals need to know how to express themselves in the language of graphics effectively and eloquently. Yet information graphics is rarely taught in schools or is the focus of on-the-job training. Now, for the first time, Dona M. Wong, a student of the information graphics pioneer Edward Tufte, makes this material available for all of us. In this book, you will learn:
to choose the best chart that fits your data;
the most effective way to communicate with decision makers when you have five minutes of their time;
how to chart currency fluctuations that affect global business;
how to use color effectively;
how to make a graphic “colorful” even if only black and white are available.
The book is organized in a series of mini-workshops backed up with illustrated examples, so not only will you learn what works and what doesn’t but also you can see the dos and don’ts for yourself. This is an invaluable reference work for students and professional in all fields.
The definitive guide to the graphic presentation of information.
In today’s data-driven world, professionals need to know how to express themselves in the language of graphics effectively and eloquently. Yet information graphics is rarely taught in schools or is the focus of on-the-job training. Now, for the first time, Dona M. Wong, a student of the information graphics pioneer Edward Tufte, makes this material available for all of us. In this book, you will learn:
to choose the best chart that fits your data;
the most effective way to communicate with decision makers when you have five minutes of their time;
how to chart currency fluctuations that affect global business;
how to use color effectively;
how to make a graphic “colorful” even if only black and white are available.
The book is organized in a series of mini-workshops backed up with illustrated examples, so not only will you learn what works and what doesn’t but also you can see the dos and don’ts for yourself. This is an invaluable reference work for students and professional in all fields.
You May Also Like
















Find at Prairie Mall in Grande Prairie, AB
Visit at Prairie Mall in Grande Prairie, AB