


Gifting Made Simple
Give the Gift of ChoiceClick below to purchase a Prairie Mall eGift Card that can be used at participating retailers at Prairie Mall.Buy Gift CardHome
Economy of Madagascar
Coles
Loading Inventory...
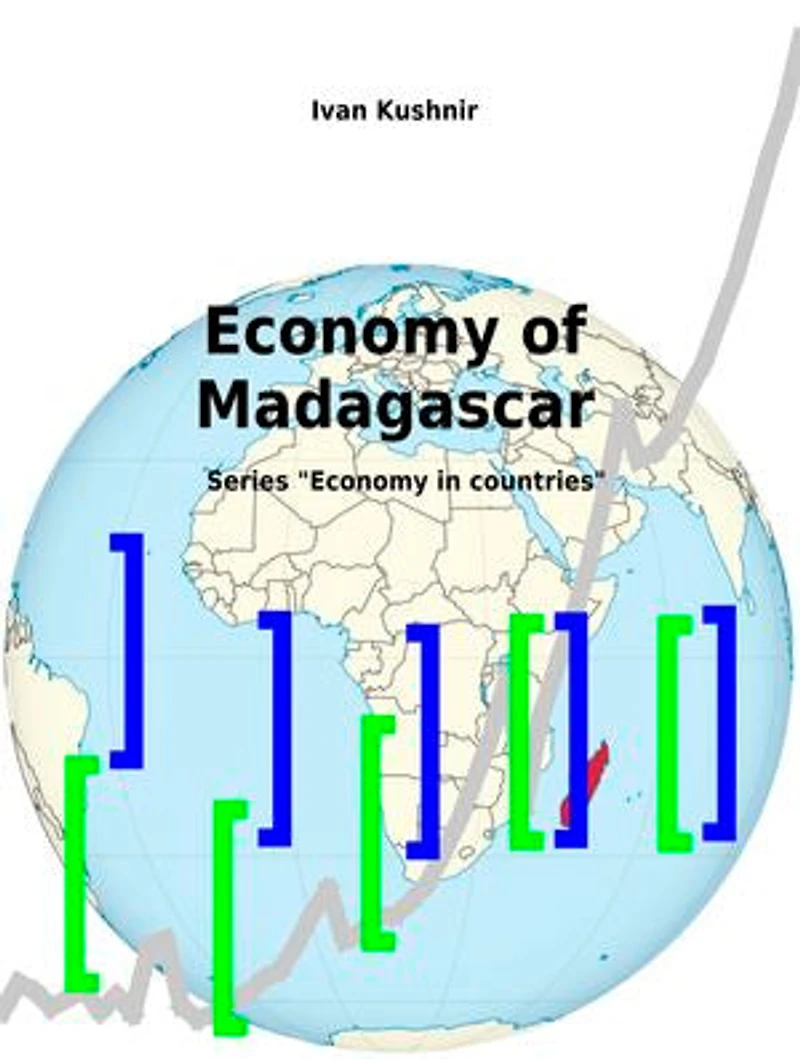
Economy of Madagascar in Grande Prairie, AB
Current price: $5.42
Coles
Economy of Madagascar in Grande Prairie, AB
Current price: $5.42
Loading Inventory...
Size: Kobo eBook
*Product information and pricing may vary - to confirm current pricing, availability, shipping, and return information please contact Coles. In the event of a pricing discrepancy, the retailer's price will apply.
This book about the economy of Madagascar from the 1970s to the 2010s. Source data from UN Data.
Size. In the 2010s, the GDP of Madagascar was equal to $12.2 billion per year; the value of agriculture was $3.2 billion. Since the share in the world is between .01% and .1%, the country is classified as a small economy.
Productivity. In the 2010s, the gross domestic product per capita was $510.0, the value of agriculture per capita was $132.2. Since the productivity is less the average below average, the economy is classified as least developed.
Growth. In the 2010s, the growth of GDP was 2.9%; the growth of agriculture was 0.52%.
Structure. In the 2010s, the economy of Madagascar consisted of: services (27.9%), agriculture (27.1%), trade (16.0%), industry (13.6%), transportation (8.7%), and construction (6.7%).
Exports and imports. In the 2010s, the imports were 25.5% higher than the exports, the net imports were equal to 6.9% of the GDP. The technological structure of exports are not better than the structure of imports.
Consumption and reproduction. The attitude of reproduction to the consumption is not better than the global average, so the share of GDP in the world will not increase.
This book about the economy of Madagascar from the 1970s to the 2010s. Source data from UN Data.
Size. In the 2010s, the GDP of Madagascar was equal to $12.2 billion per year; the value of agriculture was $3.2 billion. Since the share in the world is between .01% and .1%, the country is classified as a small economy.
Productivity. In the 2010s, the gross domestic product per capita was $510.0, the value of agriculture per capita was $132.2. Since the productivity is less the average below average, the economy is classified as least developed.
Growth. In the 2010s, the growth of GDP was 2.9%; the growth of agriculture was 0.52%.
Structure. In the 2010s, the economy of Madagascar consisted of: services (27.9%), agriculture (27.1%), trade (16.0%), industry (13.6%), transportation (8.7%), and construction (6.7%).
Exports and imports. In the 2010s, the imports were 25.5% higher than the exports, the net imports were equal to 6.9% of the GDP. The technological structure of exports are not better than the structure of imports.
Consumption and reproduction. The attitude of reproduction to the consumption is not better than the global average, so the share of GDP in the world will not increase.
You May Also Like








![Madagascar: The Ultimate Collection [Blu-ray] (Sous-titres franais)](https://cdn.mall.adeptmind.ai/https%253A%252F%252Fwww.sunriserecords.com%252Fimages%252Fdefault%252Fthumbnails%252Fproducts%252F8fb3ed582ed8bfcf79f92eb6f89780fa.jpg_medium.webp)








Find at Prairie Mall in Grande Prairie, AB
Visit at Prairie Mall in Grande Prairie, AB